2023 Year End Summary for SARS-CoV-2
Covid Summary for 2023
By John L Elliott MS
This post is a quick 2023 Year end summary for SARS-CoV-2 in the United States from CDC weekly data. Significantly, I decided to process the CDC weekly data from the CDC Website. As my mentor John Neal PhD said, generally look at the simple statistics first. Accordingly, I downloaded the CDC weekly data into Excel. Afterwards, I then began processing the numbers to get the easy to understand averages.
Descriptive Statistics 2023 Year End Summary for SARS-CoV-2
Total admissions to US Hospitals for COVID 2023
- Total admissions 875,681
- Average per week 17,170.22
- Average per Month 72,973.42
By Month
- January 142,047
- February 102,545
- March 78,054
- April 65,614
- May 35,378
- June 27,440
- July 27,440
- August 55,776
- September 97,480
- October 65,361
- November 68,758
- December 99,935
Since The Beginning of SARS-CoV-2
- Total Hospitalization 6,622,268
- Total Deaths 1,163,040

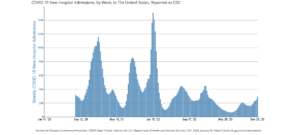
CDC total summary graph
Epidemiology Summary for 2023
Here are the trends from the data. It appears that the bad months are August to April. The light months are May to July. Therefore from the data the fall and winter months see increases in Covid cases.
Going into 2024
The following trends are noted:
- Positive last Week December 30 up .7%
- Emergence room admissions up 12%
- Hospital admissions up 16.7%
- Deaths up 10%
Current active variants are JN.1 and HV.1
What CDC is doing about SARS-CoV-2 Variant JN.1
Furthermore the CDC will continue to track JN.1 and other variants, working closely with partners around the world, to provide the latest information. Moreover, it’s a great time to get an updated COVID-19 vaccine. Please get vaccinated, because if you haven’t already been vaccinated specifically the data suggests the next three months are going to be difficult this winter into spring. Per the data, the trend for infections will increase in the coming weeks.