Flu Update for Week 49 ending December 9th 2023
Tracking Seasonal influenza activity
Flu Update for Week 49 ending December 9th 2023. Currently the flu is increasing in most parts of the country. The southeast, south-central, and west coast areas of the country reporting the highest levels of activity.
Flu Virus Summary
We are seeing Influenza A at 82%. The rest is Influenza B and a few H2 variants at 18%.

The quadrivalent Vaccine appears to protect from the current Flu viruses
Clinical Laboratories Reports Summarized
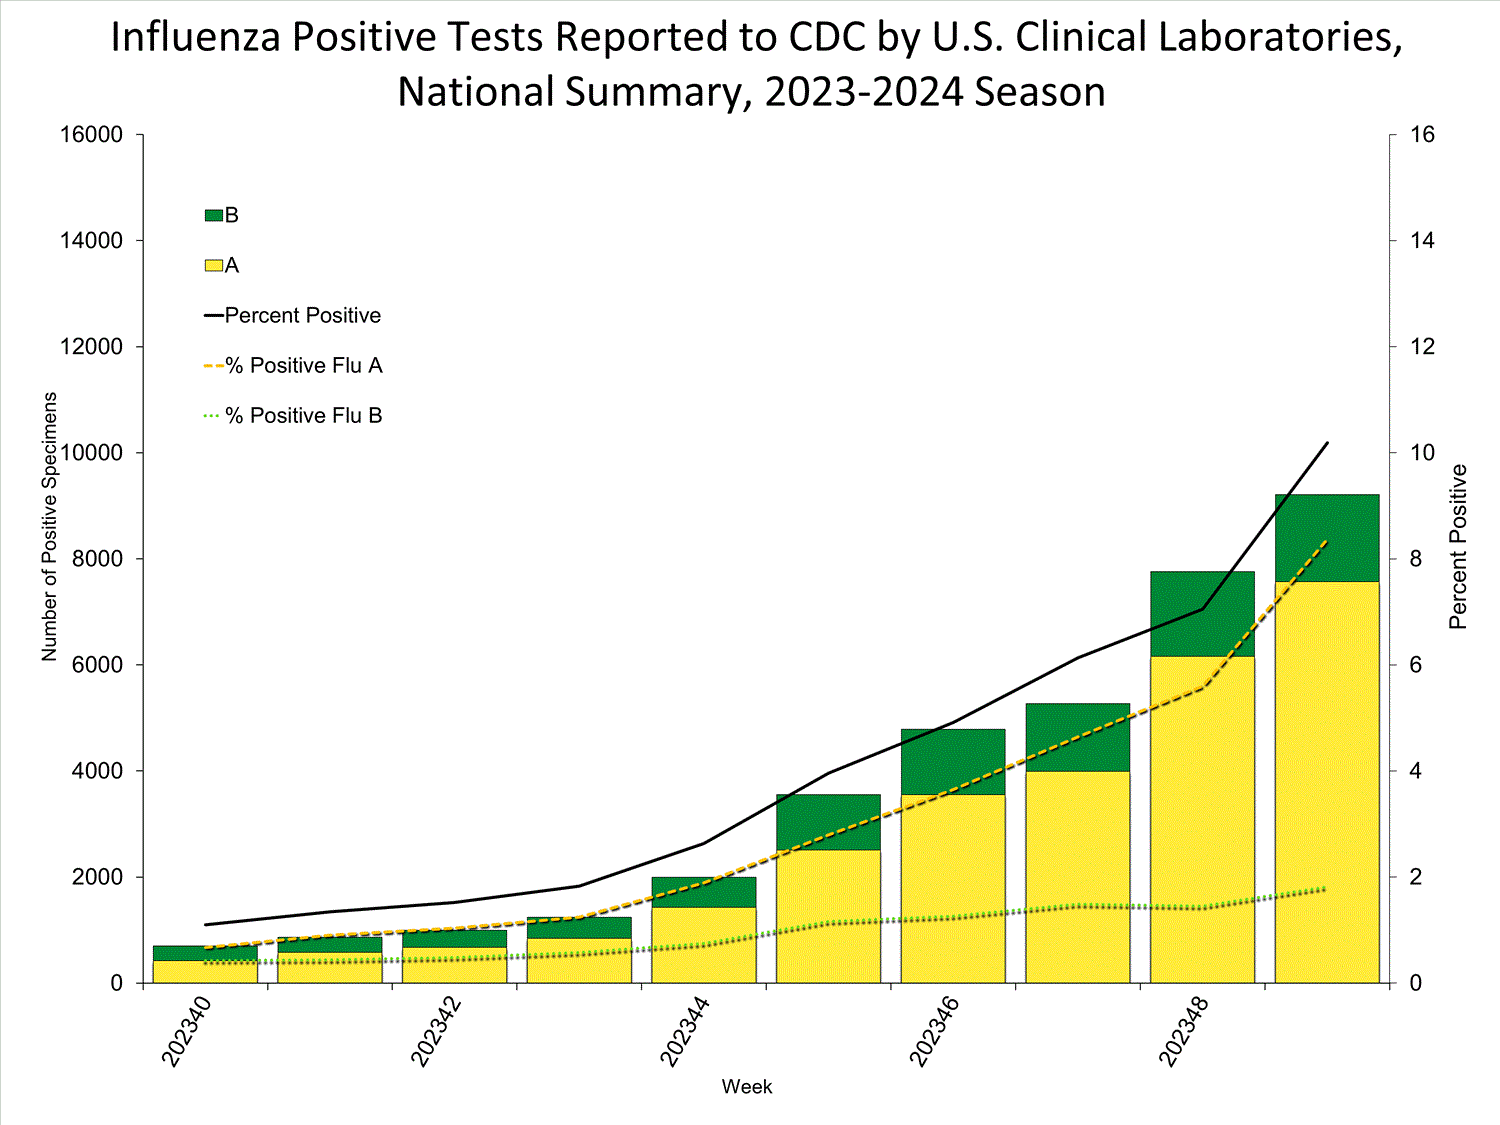
The results of tests performed by clinical laboratories nationwide are summarized below. Specifically, data from clinical laboratories (the percentage of specimens tested that are positive for influenza virus) are used to monitor whether influenza activity is increasing or decreasing.
| Week 49 |
Data Cumulative since October 1, 2023 (Week 40) |
|
|---|---|---|
| No. of specimens tested | 90,439 | 810,104 |
| No. of positive specimens (%) | 9,212 (10.2%) | 36,366 (4.5%) |
| Positive specimens by type | ||
| Influenza A | 7,570 (82.2%) | 27,751 (76.3%) |
| Influenza B | 1,642 (17.8%) | 8,615 (23.7%) |
Public Health Laboratories Reports Summarized
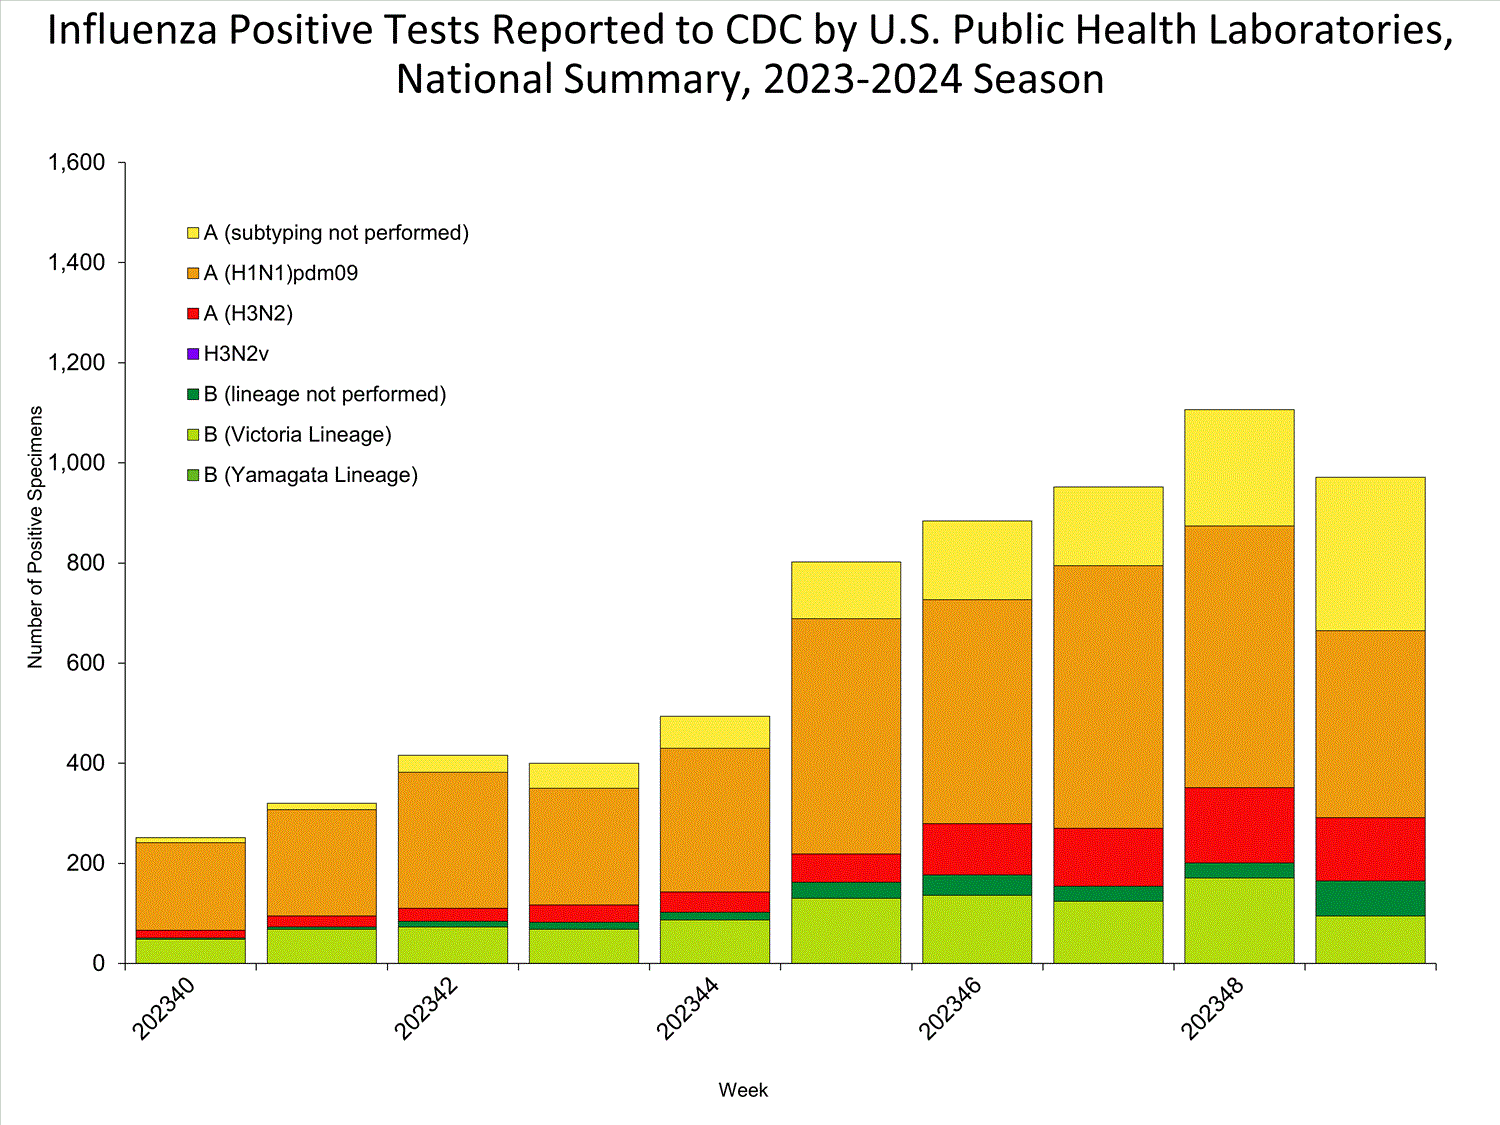
Tests results performed by public health laboratories nationwide are summarized below. Currently, the data from public health laboratories used to monitor the proportion of circulating influenza viruses. Therefore, this data summarizes the influenza subtype/lineage variants.
| Week 49 |
Data Cumulative since October 1, 2023 (Week 40) |
|
|---|---|---|
| No. of specimens tested | 3,060 | 32,227 |
| No. of positive specimens | 971 | 6,596 |
| Positive specimens by type/subtype | ||
| Influenza A | 806 (83.0%) | 5,345 (81.0%) |
| Subtyping Performed | 500 (62.0%) | 4,209 (78.7%) |
| (H1N1)pdm09 | 374 (74.8%) | 3,519 (83.6%) |
| H3N2 | 126 (25.2%) | 690 (16.4%) |
| H3N2v | 0 (0.0%) | 0 (0.0%) |
| Subtyping not performed | 306 (38.0%) | 1,136 (21.3%) |
| Influenza B | 165 (17.0%) | 1,251 (19.0%) |
| Lineage testing performed | 95 (57.6%) | 1,000 (79.9%) |
| Yamagata lineage | 0 (0.0%) | 0 (0.0%) |
| Victoria lineage | 95 (100%) | 1,000 (100%) |
| Lineage not performed | 70 (42.4%) | 251 (20.1%) |
Summary
Nationwide during Week 49, 4.4% of patient visits reported through ILINet were due to respiratory illness that included fever plus a cough or sore throat, also referred to as ILI. This has increased compared to Week 48 and is above the national baseline of 2.9% for the sixth consecutive week. Link back to our last Flu Post.
References
LINet is a system that monitors visits for respiratory illness called ILI
The Current State map on LiNet Weekly Influenza Surveillance Report

